CICERO PERSPECTIVE
What to consider
With the rise of AI and increasing popularity of tools like ChatGPT, there have been discussions around the bias built into data. While the systems and infrastructure that house the data are not inherently biased, the way the data was collected and is interpreted can be biased. An extensive article on algorithmic bias detection and mitigation from Brookings called attention to issues with the COMPAS (Correctional Offender Management Profiling for Alternative Sanctions) algorithm that were originally raised by ProPublica.2 The algorithm is used by judges to predict whether defendants are likely to reoffend. ProPublica found that African-Americans were more likely to be assigned a higher-risk score, resulting in longer periods of detention awaiting trial, compared to whites who were equally likely to re-offend. A more recent article3 in Popular Science looked at the same issue with the COMPAS algorithm and shared an experiment that utilized Mechanical Turk to test and pay random participants to determine whether they thought a defendant was likely to commit another crime in the next two years. Popular Science found that the random users had almost the exact same level of accuracy and bias as the COMPAS algorithm. As they stepped back from the data and looked at it from a broader perspective, they found that the dataset that informed the algorithm and the random participants has bias built in. “Black individuals are more likely to have prior crimes on their record and this discrepancy is most likely what caused the false positive and false negative error rate”, which ultimately led to the bias in predictions from both groups.
The Actionable Intelligence for Social Policy (AISP) at the University of Pennsylvania demonstrated this bias in data in the following statement: “Building data infrastructure without a racial equity lens and understanding of historical context will exacerbate existing inequalities along the lines of race, gender, class, and ability.”4
As AISP points out and the COMPAS algorithm case demonstrates, it is the responsibility of those who are collecting or analyzing data to intentionally incorporate an equity lens into their work. This is often easier said than done, and budget constraints or other restrictions may limit the extent to which equity can be fully incorporated. In these instances, it’s important for both those who are conducting the research and analysis, as well as those who are disseminating the report, to acknowledge where the shortcomings are and perhaps even include what would have been done differently if those limiting factors weren’t present.
An Equitable Approach to Data Collection, Analysis, and Dissemination
Data equity is a space that continues to evolve and develop, and there are multiple stages within research and analysis where an equity lens can and should be applied to incorporate equity more effectively into monitoring and evaluation processes. Figure 1 below outlines data life cycle stages.
Figure 1: Data Life Cycle Stages
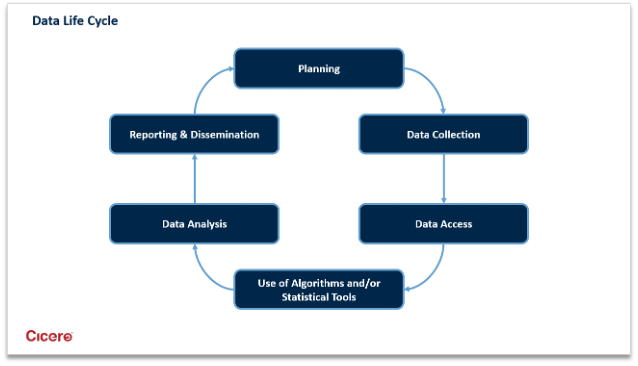
Sources: https://aisp.upenn.edu/wp-content/uploads/2022/07/AISP-Toolkit_5.27.20.pdf4; https://www.ncbi.nlm.nih.gov/pmc/articles/PMC8110889/5
While there are specific considerations for each stage, every stage should involve stakeholder engagement in some form or capacity. The Belmont Report found three key principles for protecting human subjects at the heart of every data life cycle stage. The Belmont Report Principles are6:
- Respect for Persons: Individuals should be treated as autonomous agents and persons with diminished autonomy are entitled to protection. There are two moral requirements: the requirement to acknowledge autonomy and the requirement to protect those with diminished autonomy.
- Beneficence: Two general rules have been formulated as complementary expressions of beneficent actions in this sense: 1) do not harm and 2) maximize possible benefits and minimize possible harms.
- Justice: There are several widely accepted formulations of just ways to distribute burdens and benefits. Each formulation mentions some relevant property on the basis of which burdens and benefits should be distributed. These formulations are (1) to each person an equal share, (2) to each person according to individual need, (3) to each person according to individual effort, (4) to each person according to societal contribution, and (5) to each person according to merit.
For a more in-depth look on how these three key principles are applied to each stage of the data life cycle, see this brief put together by members of the Urban Institute with funding from the Robert Wood Johnson Foundation.7
While most of the references and language in this paper focus on race, it’s important to embrace and apply all of these principles to gender, class, and ability as well.
Stage 1: Planning
There are multiple opportunities in the Planning Stage to incorporate an equity lens to clearly define your primary goals and objectives. According to We All Count, one of the first steps is to identify, acknowledge, and mitigate any power structures that may be present (i.e., power dynamics between the researcher and the community being researched).8 Once you’ve evaluated and altered the power dynamics and objectives as needed, then you need to establish how you are going to get the data you need and what equity implications you need to consider in your sourcing. According to AISP, key questions to consider in this stage are:
- Why is this work necessary?
- Who does the work benefit?
- How does it benefit the community at large?
- Who can the process/product harm?
It is important to consider the project team composition in this stage to ensure that a breadth of perspectives is included throughout the project and that the diversity in the data is also reflected in the project team.
Some of the guiding questions9 for incorporating culturally responsive evaluation practices and an equity-based perspective from Manpower Demonstration Research Corporation (MDRC) focus on the project management team and project design and include:
- To what extent does the project team reflect multiple backgrounds and cultures?
- What are the baseline conditions of equity, and of structural barriers to equity, in the ecosystem where the project will take place? How can the project team deepen its knowledge of baseline conditions to develop a better project?
- Are key stakeholders and communities actively participating in the decision-making for the project’s design?
- How is the design focused on being strengths-driven (attributes and assets) versus being deficit-based (limitations)?
- What key sociocultural characteristics surrounding the project may play a role in program implementation?
Stage 2: Data Collection
Typically in this stage, researchers would work with an Institutional Review Board (IRB) to assess the level of risk that the research activities pose to study participants and how that risk might differ based on context and participants relative position to power.9 However, researchers are often not involved with organizations that have an IRB and need to conduct this assessment on their own with the key stakeholders involved.
Several key considerations in this stage include:
- Collecting qualitative data in addition to quantitative data
- Providing an honorarium to study participants
- Have a diverse team collecting the data
- Identify data collection tools to use that eliminate method or measurement biases
- Perform cognitive testing with study participants to examine how they will interpret questions, items, and instructions
- Security and anonymization of data as it comes in
Quantitative data can often overlook the overall context. Qualitative data, such as focus groups and in-depth interviews can help provide context to the quantitative data that was collected, enabling researchers to have a better understanding of the overall story behind the data.
Having a diverse project team will allow for unique life experiences and perspectives to be brought to bear on every stage of the project. Performing cognitive testing with study participants will ensure that the research tools are effective and efficient in addressing various research questions, since many measurement tools and scales were developed by non-minority researchers and test in non-minority samples.10
Specific data security measures should be in place when collecting data and the data should be anonymized as much as possible to protect the identities of those involved.
Given various resource constraints, such as members of the research team’s lack of applicable lived experience or project budgetary constraints, several of these key considerations may not be possible and it is the responsibility of the project team to acknowledge these shortcomings and to mitigate them as best as possible.
Stage 3: Data Access
Similar to the last key consideration in the data collection stage, it is important to consider the different types of data and the accessibility of each. AISP specifically calls out Open Data, Restricted Data, and Unavailable Data. When looking at Restricted Data (e.g., data that typically requires a data sharing agreement), AISP emphasizes that researchers should be able to answer the following questions:
- Why do you want access to the information? (e.g., research, evaluation, or another purpose)
- What type of information do you want to access? (e.g., aggregate information or identified records)
- Who are you? (e.g., agency analyst, independent evaluator, or concerned citizen)
- How will you share the information? (e.g., anonymized findings via dashboard, aggregate reporting in a static document, publicly released names)
Research conducted by Dr. Amy L. Hawn Nelson and Sharon Zantis with a diverse 15-person workgroup came up with the following guidance on encouraged and discouraged data access and use.5
The workgroup broadly encourages:
- Inclusive participatory governance around data access and use
- Social license for data access and use
- A developmental approach to data sharing and integration
The workgroup broadly discourages:
- Access to individual-level linked data
- Data use for enforcement or investigation actions against residents
- Use of predictive algorithms without determining responsibility, explainability, accuracy, auditability, and fairness
- Use of linked data across institutions that have patterns of institutional racism, specifically, law enforcement, which may have committed significant racialized harm without sufficient safeguards in place
Stage 4: Use of Algorithms and/or Statistical Tools
Not all researchers will utilize algorithms or statistical tools to evaluate the data they have collected. For those that do, it’s imperative that they follow some basic guidelines.
Fairness, Accountability, and Transparency in Machine Learning provides the following guidelines11:
- Responsibility: Make available externally visible avenues of redress for adverse individual or societal effects of an algorithmic decision system, and designate an internal role for the person who is responsible for the timely remedy of such issues.
- Explainability: Ensure that algorithmic decisions as well as any data driving those decisions can be explained to end-users and other stakeholders in non-technical terms.
- Accuracy: Identify, log, and articulate sources of error and uncertainty throughout the algorithm and its data sources so that expected and worst case implications can be understood and inform mitigation procedures.
- Auditability: Enable interested third parties to probe, understand, and review the behavior of the algorithm through disclosure of information that enables monitoring, checking, or criticism, including through provision of detailed documentation, technically suitable APIs, and permissive terms of use.
- Fairness: Ensure that algorithmic decisions do not create discriminatory or unjust impacts when comparing across different demographics (e.g. race, sex, etc).
It is also highly recommended that anyone who is using an algorithm also have a Social Impact Statement that incorporates the above principles and describes how they will be operationalized in practice.
For a more thorough examination and understanding of how to incorporate equity into the use of statistical tools, we recommend this document from the Assistant Secretary for Planning and Evaluation (ASPE) Office of Human Services Policy.12
Stage 5: Data Analysis
As AISP outlines, “incorporating a racial equity lens during data analysis includes incorporating individual, community, political, and historical contexts of race to inform analysis, conclusions and recommendations.”
Child Trends has outlined key considerations for this stage as follows10:
- Researchers should confront assumptions and implicit biases in data analysis by identifying their own biases and engaging in self-reflection to ensure that these biases aren’t introduced into the analysis.
- Researchers should disaggregate data to be able to examine important variables by different subgroups and uncover the heterogeneity of experiences both between and within subgroups.
- When disaggregating data, researchers must be careful that it doesn’t lead to sample sizes that reveal the identities associated with the data. For example, if surveying a student population that is comprised of a few minorities and the rest of the population is primarily White or Caucasian, researchers would not want to compare the data from the minorities to the rest of the population as this could easily single them out.
- Researchers can go more in-depth with quantitative data by exploring the intersectionality of race with other dimensions of identity and asking why the trends revealed in this intersectional analysis may occur.
- Researchers should ask explicit questions about communities’ (i.e., stakeholders’) concerns when collecting qualitative research. Qualitative research offers important perspectives and information not captured by quantitative research methods.
- Researchers should seek to involve communities in data interpretation, such as through workshops in which community members code, categorize, and develop themes for the data.
Some guiding questions from MDRC in this stage are9:
- Is there insight learned from engaging with respondents for data collection that makes the team want to revisit their pre-registered analysis plan prior to executing analyses?
- Do the measures of demographics or identifying characteristics align with how the community would define themselves? What are the limitations of the selected approach?
- How will qualitative findings regarding participants’ experiences in and perception of the program influence the interpretation of the quantitative findings regarding the outcomes of the program?
- For studies that include qualitative data analysis, how are the sociocultural biases of the coders addressed in the analytic approach?
Stage 6: Reporting & Dissemination
In this final stage of the data life cycle, findings are communicated internally and/or externally. Based on the intended audiences, the project team should consider various modes for presenting the findings. As the Career and Technical Education Research Network outlines in their Equity Framework for CTE Research13, applying an equity lens to this stage involves “being thoughtful and intentional when interpreting study results, deciding what to share and how, creating a narrative to place the interpretation in context, and using different strategies to share information with various audiences.” Examples of ways to disseminate information shared by AISP include briefs, interactive documents, websites, dashboards, social media content, data walks, posters, and infographics.
As noted earlier, it’s important to call out where the project fell short in terms of incorporating an equity lens. One of the positive practices that AISP calls out is to acknowledge structural racism or other harms to communities that are embedded in the data.
Some of the guiding questions from MDRC for this stage include9:
- Is the language in the product inclusive with respect to the participants (for instance, using “person-first” language)?
- Does the product discuss or acknowledge the structural biases that created the conditions within which the project occurred and/or was created to address?
- Has the report been reviewed by individuals with diverse perspectives, including those in the community under study? If individuals from the community under study are not engaged as reviewers or co-authors, what perspectives might be missing?
- Has the community/organization/network been consulted in what kind of products they would find useful?
- Are there different types of media for reaching specific audiences or stakeholders?
Conclusion
By applying an equity lens at each stage of the data life cycle, we can improve the insights we pull from the data, acknowledge any structural biases, and better ensure that the story we tell is inclusive of the perspectives of those whose data we use. In doing so, we can better position ourselves and those we work with to promote equity and drive impact for the communities we serve.
Further Reading
This paper is high-level overview of how to incorporate equity into research and analysis. For those interested in learning more, we recommend diving deeper into the following resources:
- The Urban Institute
- Child Trends
- Manpower Demonstration Research Corporation (MDRC)
- We All Count
- Career & Technical Education Research Network
- Actionable Intelligence for Social Policy (AISP) at the University of Pennsylvania
- The Belmont Report from the Office for Human Resource Protection (OHRP)
- Fairness, Accountability, and Transparency in Machine Learning (FAT/ML)
- Assistant Secretary for Planning and Evaluation (ASPE) Office of Human Services Policy
- CDC Foundation Health Equity Strategy Office
- MEASURE Evaluation at UNC Chapel Hill
Endnotes
- https://www.brookings.edu/research/algorithmic-bias-detection-and-mitigation-best-practices-and-policies-to-reduce-consumer-harms/
- https://www.popsci.com/recidivism-algorithm-random-bias/
- https://aisp.upenn.edu/wp-content/uploads/2022/07/AISP-Toolkit_5.27.20.pdf
- https://www.ncbi.nlm.nih.gov/pmc/articles/PMC8110889/
- https://www.hhs.gov/ohrp/regulations-and-policy/belmont-report/read-the-belmont-report/index.html#xrespect
- https://www.urban.org/sites/default/files/publication/102346/principles-for-advancing-equitable-data-practice.pdf
- https://weallcount.com/the-data-process/
- https://www.mdrc.org/sites/default/files/Equity-Guiding_Questions.pdf
- https://www.childtrends.org/publications/a-guide-to-incorporating-a-racial-and-ethnic-equity-perspective-throughout-the-research-process
- https://www.fatml.org/resources/principles-for-accountable-algorithms
- https://aspe.hhs.gov/sites/default/files/documents/80123172bbe4458a06259535dc3fcfc3/Intresectionality-Resrch-Anlysis.pdf
- https://cteresearchnetwork.org/sites/default/files/2022-10/CTE-EquityFramwkChcklst2-508.pdf

Start a Conversation
Thank you for your interest in Cicero Group. Please select from the options below to get in touch with us.